
Hammer
Long wick, full reclaim
- By
- 42Fibonacci
- Updated
- Read time
- 8–10 min
A Hammer is a single-candle reversal pattern with a small body near the top of its range and a long lower shadow at least twice the body. Appearing after a downtrend, it shows sellers pushed price down but buyers recovered almost everything by the close. A later close above its high, often the next session, confirms it.
- Type
- Single-candle reversal
- Signal
- Bullish (after downtrend)
- Where to look
- At support or a key moving average
- Body
- Small, near the top
- Story
- Sellers tried, buyers slammed it back
- Confirmation
- A later close above its high, often the next session
- Stop
- Below the Hammer's low
What Makes a Hammer
The Hammer is a single-candle pattern defined by its shape: a small real body near the top of the range, a long lower shadow, at least about twice the body (the classic rule of thumb), and little to no upper shadow. That ratio names the shape; the candle's range against a normal day says how far sellers got (see the Takuri Line guide).
One requirement is part of the definition, not a suggestion: the shape only counts as a Hammer after a decline. The identical candle after an uptrend is a different pattern — the bearish Hanging Man — covered in the lookalikes section below.
The name comes from exactly what it looks like: a small head sitting on a long handle, like a hammer striking the ground. The metaphor fits — the market is trying to hammer out a bottom.
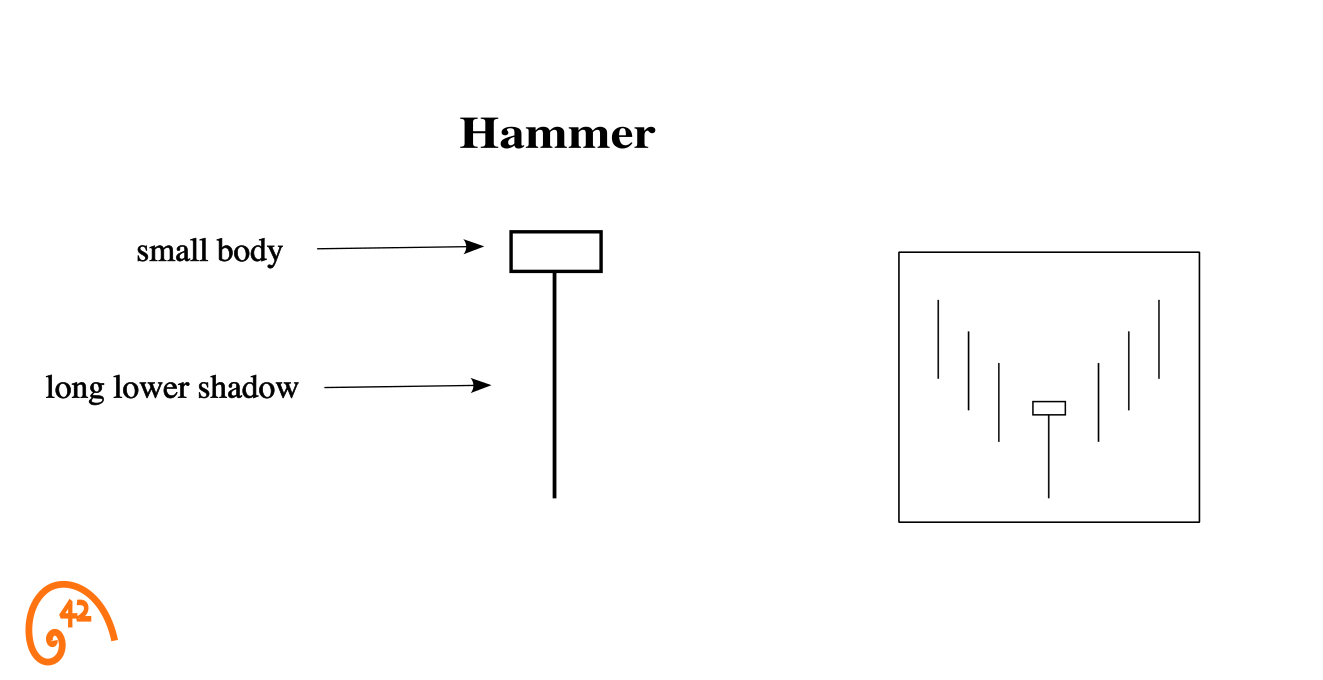
- Body
- Small, near the top of the range. Color is not critical — green or red both count.
- Lower shadow
- Typically at least 2x the body length.
- Upper shadow
- Minimal or absent. Buyers held control into the close.
How a Hammer Forms
Every candlestick is a compressed story. The Hammer's story is about a power shift that happens in a single session. Here's what's actually going on:
"Another red day. Stops are getting hit. No reason to buy yet."
The session opens and sellers immediately take control. Price drops, continuing the decline from previous days. Bears are confident. Longs are panicking.
"Wait — it's holding. Someone is buying down here."
At some point during the session, buying pressure appears. Maybe at support, maybe at a round number. Each push lower gets absorbed. The decline stalls.
"They're covering. Price is climbing back. The bears lost this one."
Buyers push back with force. Price climbs back toward the open. Short sellers cover. By the close, almost all of the decline has been erased. The long lower shadow is what's left — the scar of a battle the bears lost.
Here's what many traders get wrong: the Hammer doesn't mean buyers have taken over. It means bears lost their grip — for one session. That's the first crack in a downtrend, not the reversal itself.
Whether that crack turns into something bigger depends entirely on what happens next. Think of the Hammer as a question, not an answer: "Are sellers still in control?" The sessions that follow provide the answer.
Is a Hammer Bullish or Bearish?
Bullish — conditionally. A Hammer is a bullish reversal signal when it forms after a decline, and even then only once a later close above its high confirms it. The identical shape after an uptrend is the bearish Hanging Man. So the honest answer has three parts: right shape, right context, and follow-through — remove any one and you don't have a signal.
How reliable is it? We deliberately don't quote a win rate — published figures contradict each other, and any single number hides what differs from one Hammer to the next: context. A Hammer at real support, after a real downtrend, on real volume, with confirmation, is a different animal from the same shape floating mid-range. (One related read: when a Hammer forms as the middle candle of a Morning Star, traders often read the three-candle version as more complete.)
Hammer vs. Hanging Man (and Other Lookalikes)
The Hammer has siblings that look almost identical but carry completely different messages. Confusing them is one of the most common mistakes in candlestick analysis. The difference isn't the shape — it's the context.
- Long lower shadow, small body near top
- After a downtrend — buyers rejected the low
- Identical shape to a Hammer
- After an uptrend — sellers showed they can push it down
- Long upper shadow, small body near bottom
- After a downtrend — buyers tried, then gave back
- No real body — open ≈ close ≈ high
- Same rejection story, but as pure indecision
The Hanging Man is the same physical shape as the Hammer — long lower shadow, small body near the top — but it appears after an uptrend instead of a downtrend, and that flips the read entirely. Buyers had been in control, then sellers pushed price well down during the day, even though buyers took it back by the close. It's a bearish warning where the Hammer is a bullish reversal — same candle, opposite signal, context is everything.
The Dragonfly Doji is the one that trips people up the most. It looks almost identical to a Hammer — long lower shadow, close near the high — but the key difference is the body. A Hammer has a small but visible real body. A Dragonfly has essentially no body at all (open ≈ close ≈ high). Both signal sellers were rejected; the Hammer leans directional, the Dragonfly leans indecisive.
The Inverted Hammer is the mirror — same downtrend setup, but the long upper shadow signals buyers' first real attempt to overtake the sellers. The push didn't hold this session, but it's the first time bulls challenged the trend. It closes near its low, so it needs more proof: a later close above its high.
Put together, the whole family is a simple two-by-two: two shapes, two contexts, four names. Lower-wick shape after a decline = Hammer; after a rally = Hanging Man. Upper-wick shape after a decline = Inverted Hammer; after a rally = Shooting Star (the bearish mirror, covered on the Inverted Hammer page). Memorize the grid and you'll never mislabel one again. One more nuance: the Dragonfly Doji keeps its name after either trend, while the Hammer is a downtrend-only pattern by definition — though as a reversal signal the Dragonfly, too, wants a decline behind it.
One more relative of the Hammer itself: a Hammer whose lower shadow runs about three or more times its body is often called a Takuri Line. It trades the same way, but a bigger ratio is not automatically a bigger rejection: a tiny body can inflate it. Read the Takuri Line guide →
A pattern without context is just a shape. A shape in the right place is a signal.
How to Trade the Hammer
The Hammer is one of the most recognized patterns in trading — and one of the most misused. Here's the difference between how beginners trade it and how experienced traders trade it.
Make sure there's a real downtrend
This is the most common mistake. A Hammer only means something after a sustained decline — lower highs, lower lows, multiple sessions of selling. A Hammer inside a range or after a two-day dip is just a candle with a long wick. No downtrend, no reversal signal.
Check what's underneath it
Look for Hammers at levels where you'd expect buyers to show up: prior support, the 50-day or 200-day moving average, a Fibonacci retracement level, or the bottom of a well-defined channel. If the Hammer forms in empty space with no nearby structure, there's no level giving buyers a reason to defend it.
Don't buy the Hammer — buy the confirmation
This is where patience pays. The Hammer itself is just a warning signal. Your actual entry comes on a later close above the Hammer's high, often the next session. That close is what tells you buyers are actually following through, not just covering shorts for one session. If that confirming candle also comes on above-average volume, more traders took part in the follow-through.
Know exactly where you're wrong
Before you enter, define your stop. The low of the Hammer is the natural invalidation point. If price closes below it, the rejection failed and sellers are still in control. No ambiguity, no hoping — a close below the Hammer low means the setup is dead. This is what separates a trade from a gamble.
A stock has been declining for 3 weeks. Today it drops hard in the morning but recovers to close near the high, leaving a long lower shadow. The candle looks like a Hammer. But it formed in the middle of the range — far from any moving average or prior support level. Volume is below average.
Do you act on this Hammer?
No. The shape is right but the context is wrong. No nearby support means there's no structural reason for buyers to defend this level. Below-average volume means the recovery wasn't backed by conviction. A Hammer in empty space on low volume is just a volatile candle, not a setup. Wait for one that forms at a level that matters.
Reading the Hammer in Context
Four lenses help you read whether a Hammer is a real rejection or just a volatile candle: volume, structure, momentum, and the level it forms at. Each gets its own dedicated guide; this is the quick orientation.
Volume — was the rejection fought or drifted into? A Hammer on heavy volume means many shares changed hands as buyers defended the low — they absorbed the selling rather than letting it run. Traders also watch for heavy volume on the selloff that dries up as price recovers: sellers spent their effort and couldn't hold the low. A Hammer on light volume shows fewer traders took part. Read the Candlesticks + Volume guide →
Structure — where on the chart did the Hammer form? A Hammer at the 50-day or 200-day moving average, a Fibonacci retracement, or prior horizontal support is forming where buyers have shown up before — the location gives buyers a reason to defend it. A Hammer in empty space, far from any level, has no such reason behind it. Read the Candlesticks + Moving Averages guide →
Momentum — is selling stretched or just resting? A Hammer when RSI is below 30 shows selling stretched. A Hammer when RSI is mid-range shows selling not yet stretched, so the pattern has more to prove. Read the Candlesticks + RSI guide →
Levels — did the rejection happen where traders are watching? A Hammer in the Fibonacci golden pocket of a pullback is a rejection at the exact zone many traders expect a trend to resume — location and pattern telling the same story. The same Hammer between levels has no such backing. Read the Candlesticks + Fibonacci guide →
Pattern tells you where to look, context tells you whether to act.
Seeing the Hammer in Action: $RKLB
Here is a Hammer with the context this guide describes.

Before the Hammer. Rocket Lab ($RKLB) had run hard into a July 2025 peak near $51.85, then started grinding lower — lower highs, lower closes, steady distribution. By mid-August the stock had given back more than 20% from the high and was sitting right on the 50-day moving average.
The Hammer prints. Sellers pushed price below the 50-day MA intraday — the kind of break that usually triggers stops. But by the close, buyers had reclaimed nearly all of it. The candle settled near $40.69, leaving a long lower shadow stretching down through the MA. The break failed; the level held.
The next session. Price closed above the Hammer's high. That's the confirmation: buyers didn't just defend the low, they followed through. From there, the bounce ran back toward the prior peak over the following weeks.
Why this one was tradeable. Real downtrend (multi-week decline, not a two-day dip), structural level (50-day MA, the most-watched dynamic support), strong lower shadow (clean rejection through the MA and back), and next-session follow-through. Each check this guide describes was in place before the entry.
Common Hammer Trading Mistakes
The Hammer is simple to identify and easy to misuse. The common errors are skipped steps, not misread shapes.
| Mistake | Instead |
|---|---|
| Buying the Hammer itself See a Hammer, buy immediately. The candle is the signal — why wait? | Wait for confirmation. Enter only after a later close above the Hammer's high, often the next session. That close proves buyers actually followed through. |
| Treating shape as the only requirement If the candle looks like a Hammer, it counts — in a chop zone, at the top of a bounce, two days into a shallow pullback. Shape is shape. | Shape without trend context is just a candle with a long wick. The Hammer derives its meaning from what it interrupts; if there's no real selling pressure to reject, the rejection communicates nothing. |
| Mistaking a volatile candle for a Hammer Any candle with a long lower wick counts. Close enough is good enough. | The body must be small and near the top of the range. A large body or a close in the lower half is just a wide-range candle, not a rejection. |
| Jumping in before the close At 2:30pm the candle looks like a Hammer — good enough, enter now. | Wait for the session to close. A candle that looks like a Hammer at 2:30 can turn into something completely different by 4:00. |
| Ignoring volume The shape is all that matters. Volume is just noise. | Volume shows who took part in the rejection. A Hammer on high volume means many traders took part in defending that level. Low volume means fewer traders took part. |
- A Hammer is the first crack in bearish control — not a guaranteed reversal, but a reason to pay attention
- Context matters more than shape — a Hammer at support with volume has a reason behind it that one in empty space lacks
- Don't confuse it with a Hanging Man — same shape, but after an uptrend it's a bearish signal
- Volume shows how many traders took part — above-average volume means many shares changed hands as buyers defended the low
- Always wait for confirmation: a later close above the Hammer's high, often the next session, before you act
- If the Hammer's low breaks, the setup is dead — define that as your stop before entering
Frequently Asked Questions
What is a Hammer candlestick pattern?
A Hammer is a single-candle reversal pattern with a small body near the top of the range and a long lower shadow, typically at least twice the body length. It appears after a downtrend and signals that sellers pushed price down but buyers recovered almost everything by the close.
How do you confirm a Hammer candlestick?
Wait for a later close above the Hammer's high, often the next session. That close shows buyers actually followed through — not just short covering for one session. A confirming candle on above-average volume shows more traders took part than one on thin participation.
What is the difference between a Hammer and a Hanging Man?
They look identical — same small body, same long lower shadow. The difference is context. A Hammer appears after a downtrend and is a bullish reversal signal. A Hanging Man appears after an uptrend and is a bearish warning. Same shape, opposite meaning depending on where it forms.
Where should I place my stop loss on a Hammer trade?
Below the Hammer's low. That's the natural invalidation point — if price breaks below it, the rejection failed and sellers are still in control. Define this level before you enter the trade so you know exactly where the setup is wrong, with no ambiguity.
What is the difference between a Hammer and a Dragonfly Doji?
They look very similar — both have a long lower shadow and close near the high. The difference is the body. A Hammer has a small but visible real body. A Dragonfly Doji has no body: the open, high and close sit at or near one price, so buyers only recovered to even. Both show sellers were turned back — the distinction is structural.
Does the color of a Hammer candlestick matter?
Not much. A green body means buyers closed above the open; a red one still shows the same rejection of lower prices. Focus on the shape, the shadow length, and the context, not the color. Location and confirmation matter far more.
How reliable is the Hammer pattern?
Reliability depends entirely on context. A Hammer after a sustained downtrend and at a key support level has a trend to reverse and a level under it; a Hammer mid-range has no trend to reverse and no level under it. Volume and the confirming close still have to be checked either way.
Is a Hammer candlestick bullish or bearish?
Bullish — conditionally. A Hammer is a bullish reversal signal only when it forms after a decline, and even then it needs a later close above its high, often the next session. The identical shape after an uptrend is a different pattern entirely: the bearish Hanging Man. The context is part of the definition, not an optional extra.
What is the difference between a Hammer and an Inverted Hammer?
Both appear after a downtrend and lean bullish; the difference is where the shadow is. A Hammer has a long lower shadow — sellers pushed down and were rejected. An Inverted Hammer has a long upper shadow — buyers pushed up and were pushed back. The Hammer closes near its high, so its rejection held into the close; the Inverted Hammer closes near its low, so it needs more proof: a later close above its high.
The Bottom Line
The Hammer is the market's way of saying: "Sellers tried. They failed."
It doesn't promise a reversal. It doesn't guarantee profits. What it does is mark the exact session where bearish momentum broke down — and that's valuable information.
When you see a Hammer after a clear decline, at a known support level, followed by a confirming close above its high — you're looking at a setup with its context in place. Not because the pattern is magic, but because the context lines up behind it. It can still fail, which is what the stop below the low is for.