A Dragonfly Doji is a single-candle pattern where the open, close, and high sit at or near the same price with a long lower shadow below. It shows sellers pushed price significantly lower but buyers absorbed everything to close at the high, a full rejection. Use its low as your line in the sand.
The Dragonfly Doji says: sellers tried, sellers were rejected, neither side could close in control. The long lower shadow tells the rejection — but no body means no resolution.
What Makes a Dragonfly Doji
The Dragonfly Doji is defined by three structural rules: no real body (open and close are at or near the same price), the close sits at the session high, and a long lower shadow extends well below. No upper shadow — or virtually none.
Visually, it looks like a capital T. The horizontal line at the top is where the market opened, traded, and closed. The vertical line dropping below is the ground it covered and gave back. All that selling pressure, fully absorbed.
The Dragonfly is a member of the Doji family — open ≈ close is the family trait; the hub guide covers the family and the general theory of indecision candles. One honesty note up front: a textbook Dragonfly, with open, close, and high exactly equal, is genuinely rare. Near-dragonflies with a sliver of body are what you'll actually see — and the bigger that sliver grows, the more the candle shades into Hammer territory.

How a Dragonfly Doji Forms
The Dragonfly Doji tells a strange story: sellers were completely rejected, yet the session produced no directional close. Buyers showed up to defend a level — but they didn't advance beyond it.
"This level is breaking. Stops are getting hit below."
The session opens and sellers immediately press price lower. The decline is aggressive — it may sweep below prior lows, trigger stops, or test a widely watched support level. For most of the session, it looks like another leg down.
"Wait — someone is buying every tick down here. Price is climbing back."
At some point, buying pressure materializes. Not gradually — it overwhelms the sellers. Price climbs back through the entire session range. Every short below the open is now at a loss. By the close, buyers have reclaimed the full decline.
"We're right back at the open. All that selling — erased."
Price closes where it opened, at the top of the range. The candle has no body — just a long shadow hanging below. The selling was real, the rejection was real, but the net result is zero movement. That's the Dragonfly: full rejection, zero follow-through.
This is the tension the Dragonfly Doji carries: the rejection was absolute (close at the high), but the conviction was absent (no body). It's a candle that screams "sellers failed" while whispering "but buyers didn't really push either." That duality is exactly why the next session matters so much — and why the low of the shadow is such a valuable risk anchor.
Is a Dragonfly Doji Bullish or Bearish?
It leans bullish — but it is not a verdict. The close at the high means sellers were completely rejected, which gives the Dragonfly a bullish undertone after a downtrend. But the missing body means nobody actually won the session — buyers only recovered to even. That makes it a reversal candidate that needs confirmation even more explicitly than a Hammer does, because there is no body to lean on. At the top of an uptrend the read is murkier still — sources genuinely disagree between “continuation pause” and “exhaustion warning” — so treat it there as ambiguity, not a short signal.
How reliable is it? We deliberately don't quote a win rate — and the honest evidence cuts against overconfidence: Thomas Bulkowski's candlestick testing found the Dragonfly, taken alone, resolves as a reversal only about half the time. A coin flip — until location, volume, and the confirmation candle turn it into a setup. The candle nominates; confirmation elects.
Dragonfly Doji vs. Hammer (and Gravestone)
The Dragonfly Doji sits in a visual neighborhood with several candles that share its long-shadow profile. Misidentifying it is easy — and the trading implications change depending on which candle you're actually looking at.
- Close at the high, long lower shadow
- No body — open, close, and high are the same
- Similar shape — long lower shadow, close near high
- Has a small but visible real body
- Shadows extend both above and below
- No directional lean — balanced indecision
- The exact mirror — inverted T
- Open ≈ close ≈ low, long upper shadow
The most common confusion is between the Dragonfly Doji and the Hammer. Both have a long lower shadow and close near the high. The difference is the body: if you can see daylight between the open and close, it's a Hammer. If they're stacked on top of each other at the high, it's a Dragonfly. That gap — or lack of it — changes the conviction profile. The Hammer's body says buyers finished the session ahead. The Dragonfly's flat line says they only recovered to even. Which is “stronger”? Sources genuinely disagree, and no data settles it. What is defensible: the Hammer is far more common, and the Dragonfly is the purer form of rejection-without-resolution.
The Gravestone Doji is the Dragonfly's exact mirror — and the answer to “what's the opposite of a Dragonfly?” Open, close, and low sit together at the bottom, with a long upper shadow: an inverted T. It records the opposite story — buyers pushed up and were fully rejected — and leans bearish at the top of an uptrend. Everything this guide says about reading the Dragonfly applies to the Gravestone with the directions flipped.
The Classic Doji is structurally different: it has shadows on both sides, meaning neither buyers nor sellers dominated the range. So is the Long-Legged Doji, which stretches that two-sided fight across an extreme range. The Dragonfly's one-sided shadow makes it a rejection candle, not a balance candle. Same Doji family, very different story.
The low of the Dragonfly Doji isn't just a wick — it's the line in the sand. Below it, the thesis is dead.
The Low as Your Line in the Sand
Most candlestick guides focus on entries. The Dragonfly Doji's greatest value is actually about risk. That long lower shadow creates one of the cleanest invalidation levels in candlestick analysis.
Think about what the low of the shadow represents: it's the exact price where selling pressure was at its maximum — and buyers absorbed all of it. If price returns to that level and breaks below it, the rejection has failed. The buyers who defended that line are now underwater. The entire thesis behind the trade is gone.
The low is defined by the market, not by you
Most stop levels require you to pick an arbitrary distance below a support line. The Dragonfly Doji's low is different — it's the exact price where real buying demand overwhelmed selling pressure during the session. That level was tested and defended in real time.
A close below the low kills the setup
If price closes below the Dragonfly's low, the rejection has failed. Buyers tried to hold that level and couldn't. There's no ambiguity, no "maybe it'll recover." A close below that shadow means sellers have reclaimed the ground they lost — and then some.
Position size flows from the stop
Because the Dragonfly's low gives you a precise invalidation level, you can calculate your dollar risk per share before you enter. That makes position sizing mechanical: decide how much you're willing to lose, divide by the distance from entry to the low, and you have your share count.
How to Trade the Dragonfly Doji
The Dragonfly Doji combines clear seller rejection with directional ambiguity — which means confirmation isn't optional, it's essential. Here's the sequence.
Verify a real downtrend precedes it
The Dragonfly Doji only functions as a reversal signal after sustained selling — lower highs, lower lows, multiple sessions of decline. A Dragonfly after a two-day pullback in an uptrend is not a reversal setup. It needs something to reverse.
Check what level it's sitting on
The strongest Dragonfly Dojis form where buyers have reasons to show up: a major moving average, a Fibonacci retracement zone, a prior support level, or a round-number price. Confluence between the candle and the level is what separates a setup from noise.
Wait for the next candle to close above the Dragonfly's high
Because the Dragonfly has no body, the close and the high are the same price. A confirmation candle that closes above that level proves buyers didn't just defend — they advanced. Without this close, the Dragonfly is just an interesting candle, not a trade.
Place your stop below the Dragonfly's low
The shadow's low is the invalidation point. If price breaks below it, the rejection has failed. Define this level before you enter and size your position accordingly. No stop, no trade.
A Dragonfly Doji forms at the 200-day moving average after a 15% decline. The lower shadow is extremely long — price dipped 4% below the MA intraday before recovering to close right at the MA. Volume is 1.8x average. RSI is at 28. The next session opens flat.
Where exactly do you place your stop, and why?
Reading the Dragonfly Doji in Context
Four lenses decide whether a Dragonfly Doji is a signal or just noise: volume, structure, momentum, and the level it forms at. Each gets its own dedicated guide; this is the quick orientation.
Volume — was the rejection defended or did price just drift back? A Dragonfly Doji with heavy volume near the session low means real buyers absorbed the sellers in real time — deliberate defense of a price level. The same shape on thin volume often means price dipped, nobody pushed back hard, and it floated up — not a defended low, just a sleepy tape. Read the Candlesticks + Volume guide →
Structure — where on the chart did the rejection happen? A Dragonfly Doji at a major moving average, a Fibonacci retracement, or a prior support level is buyers showing up where they've shown up before. The same Dragonfly in open space, far from any level, is just a one-day bounce with no structural anchor. Read the Candlesticks + Moving Averages guide →
Momentum — is the dominant side stretched or just resting? A Dragonfly Doji while RSI is in oversold territory (below 30) often marks the inflection — the session where downside momentum bottoms out and begins curling up. Bullish divergence (price makes a new intraday low but RSI doesn't) makes the read stronger. A Dragonfly when RSI is already flat says nothing new. Read the Candlesticks + RSI guide →
Levels — did the rejection happen where traders are watching? A Dragonfly in the Fibonacci golden pocket of a pullback is a full rejection of lower prices at the exact zone many traders expect a trend to resume — the location gives the rejection a reason. The same candle between levels is just a volatile session. Read the Candlesticks + Fibonacci guide →
Pattern tells me where to look, context tells me whether to act.
Seeing the Dragonfly Doji in Action: $AXP
Here's a Dragonfly Doji that did exactly what the candle promises — full seller rejection at a level that mattered.
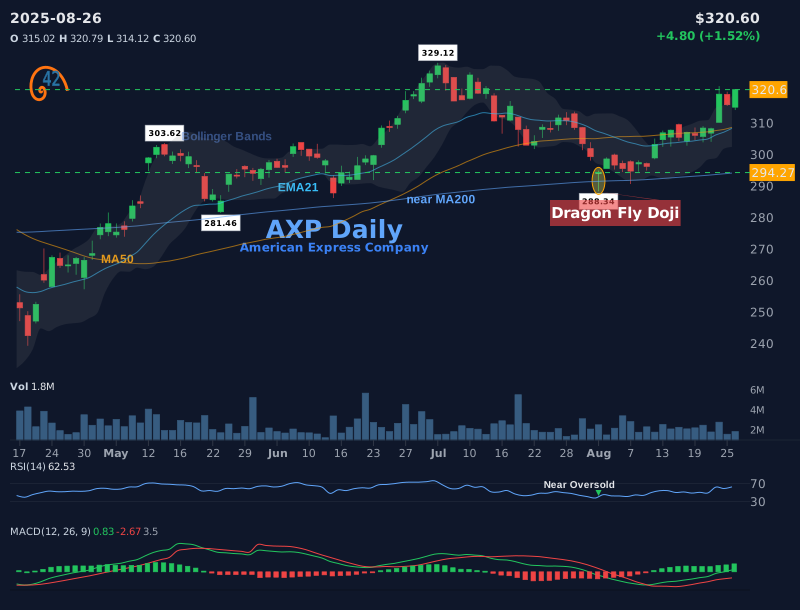
Before the Dragonfly Doji. American Express ($AXP) had been sliding since early July 2025 — from a peak near $329, the stock ground lower through late July. Not a panic, but steady distribution: lower highs, weaker bounces, the kind of controlled decline that punishes early bottom-callers.
The Dragonfly Doji prints. By early August, $AXP had dropped to the ~$288 area near its 200-day moving average. Sellers pushed price well below the MA intraday — and by the close, buyers had reclaimed every tick. Open, close, and high converged at the same price. The long lower shadow told the whole story.
The next session. A bullish close above the Dragonfly's high. Buyers didn't just defend — they advanced. That's the confirmation the Dragonfly always needs.
Why this one was tradeable. Multi-week downtrend, full rejection at the 200-day MA, RSI near oversold, and a confirming close above the Dragonfly's high the next session — every layer pointed the same way.
Common Dragonfly Doji Trading Mistakes
The Dragonfly Doji's visual similarity to the Hammer and its membership in the Doji family create a unique set of traps. Most mistakes come from conflating it with patterns it resembles but isn't.
Any candle with a long lower shadow counts — close enough.
The Dragonfly Doji requires the close to be at or near the high, with essentially no body. A candle with a long lower wick but a close in the middle of the range is a different pattern entirely.
The Dragonfly appeared — time to go long, even though the trend is crushing everything in its path.
A Dragonfly in a steep, accelerating decline is often just a one-session pause before the selling resumes. The strongest setups appear when the decline is already showing signs of deceleration — not at peak selling momentum.
I'll enter first and figure out where to exit later — maybe a fixed percentage, maybe by feel.
The shadow's low already hands you an invalidation point written by actual order flow. Sizing your trade off that level is mechanical: decide the dollar risk, divide by the distance, get the share count. Skipping that calculation turns a defined setup back into guesswork.
Valid pattern, valid entry. The stop is wherever the low is.
Dragonfly Dojis with very long shadows create wide stops. Before entering, calculate whether the risk (entry to low) is acceptable relative to your target. A valid pattern with a stop that's too wide is still a bad trade.
- The Dragonfly Doji bridges the Hammer's rejection signal and the Doji's indecision — sellers were fully rejected, but buyers produced no directional close
- The defining feature is the absent body: open, close, and high are at the same price with a long lower shadow
- The low of the shadow is the candle's greatest gift — a market-defined invalidation level for stop placement
- Confirmation is essential because the no-body structure carries inherent directional ambiguity
- Context separates signal from noise: look for a prior downtrend, a key structural level, and supporting volume
- The shadow's low often becomes a short-term support pivot the market respects going forward
Frequently Asked Questions
What is a Dragonfly Doji candlestick?
A Dragonfly Doji is a single-candle pattern where the open, close, and high are at or near the same price, with a long lower shadow extending below. It indicates that sellers pushed price significantly lower during the session, but buyers absorbed everything and closed at the high — a full rejection.
What is the difference between a Dragonfly Doji and a Hammer?
Both have a long lower shadow and close near the top of the range. The difference is the body. A Hammer has a small but visible real body — buyers closed above the open. A Dragonfly Doji has no body. The Hammer carries slightly more bullish conviction; the Dragonfly is more ambiguous.
How do you use the Dragonfly Doji's low for risk management?
The low of the lower shadow represents where buying pressure overwhelmed sellers. If price later closes below that level, the rejection has failed. Use the shadow low as your stop-loss and size your position based on the distance from entry to that low — a precise, market-defined risk per share.
Does the Dragonfly Doji work in uptrends?
In an uptrend, the Dragonfly Doji is less significant as a reversal signal because there's no sustained selling to reverse. Some sources read it there as a continuation pause — sellers tested lower prices and were rejected — while others read it as a possible exhaustion warning. Either way, treat it as ambiguity, not a signal. The pattern is most meaningful after a clear, sustained downtrend.
How do you confirm a Dragonfly Doji?
Wait for the next session to close above the Dragonfly's high. Since the Dragonfly's high equals its close and open, a confirmation candle closing above that level proves buyers are advancing, not just recovering. Volume on the confirmation session adds further weight to the signal.
How reliable is the Dragonfly Doji pattern?
Reliability depends on context. A Dragonfly Doji after a sustained downtrend, at a key support level (moving average, Fibonacci zone), with elevated volume and oversold RSI is significantly more reliable than one appearing mid-range or mid-trend. The surrounding conditions determine whether it's worth trading.
Is the Dragonfly Doji bullish or bearish?
Structurally, the Dragonfly Doji has a bullish undertone — the close at the high means sellers were completely rejected. However, the absent body means there's no directional close, so it's more ambiguous than a Hammer. In a downtrend at support, it leans bullish. Confirmation decides direction.
What is the opposite of a Dragonfly Doji?
The Gravestone Doji — its exact mirror. Where the Dragonfly closes with open, close, and high together at the top (a "T"), the Gravestone has open, close, and low together at the bottom with a long upper shadow (an inverted "T"). It records the opposite story — buyers pushed up and were fully rejected — and leans bearish at the top of an uptrend.
Can a Dragonfly Doji be red?
Technically yes — with a near-zero body, a single tick decides whether the close lands a hair above or below the open, so the candle can print marginally red or green. At that size the color is essentially meaningless. The structure (close at the high, long lower shadow) and the location carry the signal, not the tint.
The Bottom Line
The Dragonfly Doji teaches something most single-candle patterns don't: risk-first thinking. While the Hammer teaches reversal signals and the Doji teaches patience, the Dragonfly teaches you to look at a candle and immediately see where you're wrong.
That long lower shadow isn't just a record of intraday selling — it's a precisely defined level where the market told you buyers stood their ground. Below it, they didn't. That clarity is rare in trading, and it makes the Dragonfly Doji one of the cleanest patterns for stop placement in all of candlestick analysis.
When you find a Dragonfly Doji after a sustained decline, sitting on a meaningful support level, with volume confirming the rejection and momentum suggesting exhaustion — you're looking at a setup where the candle itself defines your risk. The only question left is whether the reward justifies it.
Our 42Fibonacci Scanner checks for these conditions automatically across 3,000+ stocks.
Find Dragonfly Doji setups in the scanner →In this guide
'%3e%3crect%20width='240'%20height='240'%20fill='%23FF7A00'%3e%3c/rect%3e%3cg%20transform='matrix(0.07095%200%200%20-0.07095%2015%20220.748)'%20fill='%23FFFFFF'%20stroke='none'%3e%3cpath%20d='M1365%202583%20c-628%20-81%20-1087%20-602%20-1111%20-1258%20-9%20-231%2023%20-399%20111%20-580%20207%20-427%20651%20-631%20900%20-414%20313%20274%2067%20875%20-305%20744%20-177%20-63%20-242%20-307%20-110%20-418%2098%20-83%20230%20-43%20230%2069%200%2047%20-5%2051%20-34%2029%20-55%20-42%20-117%204%20-100%2073%2020%2082%20131%20108%20196%2046%2074%20-71%20100%20-207%2058%20-316%20-65%20-174%20-281%20-266%20-437%20-185%20-146%2075%20-276%20272%20-340%20515%20-34%20128%20-39%20396%20-10%20532%20103%20479%20422%20837%20856%20958%20143%2040%20402%2039%20536%20-1%20434%20-132%20743%20-484%20841%20-959%2019%20-91%2024%20-295%2011%20-413%20-11%20-91%20-2%20-80%2029%2041%2080%20312%2017%20689%20-163%20972%20-253%20397%20-715%20623%20-1158%20565z'%3e%3c/path%3e%3cpath%20d='M2035%201809%20c-63%20-18%20-121%20-85%20-140%20-161%20-6%20-23%20-3%20-27%2027%20-33%2018%20-3%2040%20-9%2050%20-11%2011%20-3%2018%203%2023%2023%2025%20113%20189%20126%20225%2018%2031%20-93%20-7%20-155%20-243%20-409%20-86%20-92%20-88%20-96%20-85%20-138%20l3%20-43%20223%20-2%20222%20-3%200%2045%20c0%2025%20-1%2048%20-2%2053%20-3%207%20-22%208%20-191%2011%20l-98%201%2075%2083%20c167%20181%20210%20263%20204%20379%20-8%20148%20-140%20232%20-293%20187z'%3e%3c/path%3e%3cpath%20d='M1579%201733%20c-29%20-43%20-106%20-154%20-171%20-247%20-107%20-152%20-118%20-173%20-118%20-212%20l0%20-44%20173%20-2%20172%20-3%203%20-88%203%20-89%2052%204%20c32%202%2052%208%2053%2016%201%206%202%2046%203%2087%20l1%2075%2045%200%2045%200%200%2050%200%2050%20-45%200%20-45%200%20-1%20173%20c-1%2094%200%20202%201%20240%20l2%2067%20-60%200%20-60%200%20-53%20-77z%20m58%20-400%20c-3%20-2%20-52%20-2%20-110%20-1%20l-105%203%20107%20155%20106%20155%203%20-154%20c1%20-85%201%20-156%20-1%20-158z'%3e%3c/path%3e%3c/g%3e%3c/g%3e%3c/svg%3e)
42Fibonacci