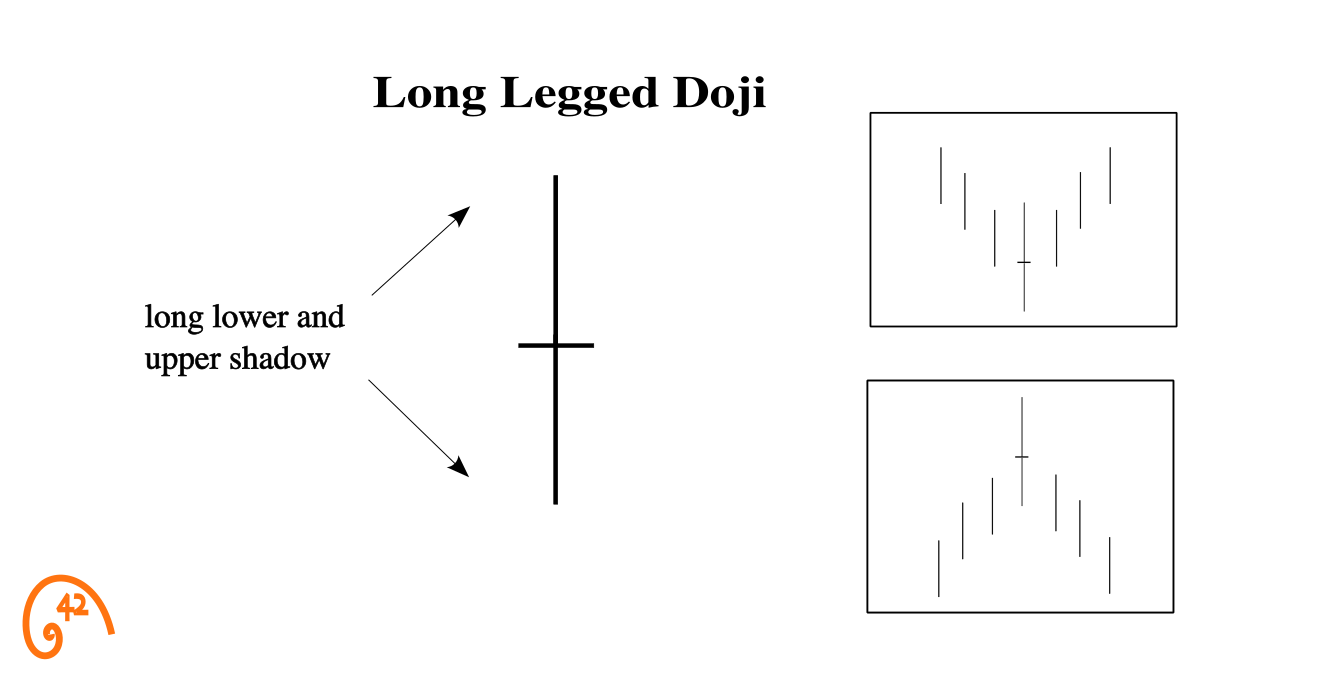
A Long-Legged Doji is a Doji variant with extremely long upper and lower shadows: open and close are nearly identical, but price traveled far in both directions. It signals intense indecision and high volatility, a violent stalemate between buyers and sellers. The wide range means wider stops, smaller positions, and often delayed confirmation.
The loudest session on the chart left the quietest result. That contradiction is the Long-Legged Doji.
What Makes a Long-Legged Doji
The Long-Legged Doji shares the Doji's defining trait — open ≈ close — but adds one critical dimension: extremely long shadows on both sides. The session's range is wide. Price traveled far in both directions. And yet the close came right back to the open. (For the family overview and the general theory of indecision candles, start with the Doji guide — this page goes deep on the long-legged variant.)
Where a classic Doji suggests a calm standoff, the Long-Legged Doji suggests a war that nobody won. The range is the evidence — both sides committed real capital and neither could hold.
How a Long-Legged Doji Forms
If a classic Doji is a polite disagreement, the Long-Legged Doji is a shouting match that ends in a draw. Here's what happened during the session:
"Major move. Price is running. Somebody knows something."
Buyers push price significantly higher from the open. The move is aggressive enough that it looks like a genuine breakout attempt. Momentum feels real. Traders start taking positions.
"Complete reversal. It's all gone — and then some."
Sellers respond with equal or greater force. Not only do they erase the rally, they push price well below the open. The session's range expands dramatically in both directions. Traders who bought the rally are stopped out.
"After all that chaos, we're right back where we started. What just happened?"
By the close, price returns to the open. The session traded over a massive range and produced zero net movement. Both sides threw everything they had and neither held. The extremely long shadows are the scars of that battle.
This is the candle that teaches you to separate activity from meaning. A lot happened during this session. Price moved dramatically. Volume was probably elevated. But the end result was a stalemate — and sometimes a stalemate after a war is more informative than a clean directional candle.
It tells you that the market is unstable. Neither side has control, and the volatility says emotions are running high. What happens next could go either way — which is exactly why the next candle matters so much.
Is a Long-Legged Doji Bullish or Bearish?
Neither — by itself, a Long-Legged Doji is neutral. It marks violent indecision, not direction. The prior trend gives it a lean — after a downtrend it reads as a potential bullish reversal; after an uptrend, a potential bearish one. Same candle, opposite stories, decided entirely by what came before it — and sometimes it resolves as neither, with the trend simply continuing after the market digests the volatility. A close beyond the Doji's range — often only after a few digestion bars — picks the direction, not the Doji itself.
The two to distinguish:
Bullish Long-Legged Doji
Appears after a downtrend. Sellers had been in control — multiple sessions of lower closes — then a Long-Legged Doji prints. Sellers pushed all the way to the lower extreme and still couldn't hold it. The wide range with no resolution doesn't mean buyers won. It means sellers exhausted their push. A louder first crack than a regular Doji.
Bearish Long-Legged Doji
Appears after an uptrend. Buyers had been in control — multiple sessions of higher closes — then a Long-Legged Doji prints. Buyers pushed all the way to the upper extreme and still couldn't hold it. The wide range with no resolution doesn't mean sellers won. It means buyers exhausted their push. A louder first crack than a regular Doji.
The classic Doji and Spinning Top read the same way: bullish after a downtrend, bearish after an uptrend. And the color of the near-invisible body — marginally green or red — carries no information at this size.
Long-Legged Doji vs. Others
The Long-Legged Doji is part of the Doji family but has a different temperament. Here's how it compares to the candles it's most often confused with.
- Extremely long shadows both sides
- Wide range, zero net movement
- Violent disagreement, not calm indecision
- Moderate shadows both sides
- Calm indecision — neither side pushed hard
- Less volatility, same stalemate
- Small but visible body — a slight lean
- Moderate shadows, less extreme range
- Indecision with a hint of direction
- Long shadow on one side only (bottom)
- One-sided rejection, not two-sided battle
- Directional lean, not pure chaos
The key distinction: the classic Doji says "nobody knows." The Long-Legged Doji says "everybody tried, nobody won." The difference is the intensity of the battle — and the wider the range, the more volatile the resolution is likely to be.
The one-sided variants complete the picture. The Dragonfly Doji puts all of its shadow below (sellers pushed, buyers reclaimed everything), and its mirror, the Gravestone Doji, puts all of it above (buyers pushed, sellers reclaimed everything). Both are rejections with a clear loser. The Long-Legged Doji tested both extremes and rejected both — that two-sidedness is exactly what makes it pure indecision rather than a directional lean.
A wide range without a close away from the open is volatility without conviction. That's the lesson most traders learn the expensive way.
The Rickshaw Man: A Special Case
One named variant is worth knowing: the rickshaw man. It's a Long-Legged Doji whose open and close sit at or very near the exact midpoint of the session's range — the tiny body centered between two long shadows, a shape reminiscent of a rickshaw's long carrying poles (a term popularized by Steve Nison). Every rickshaw man is a Long-Legged Doji; not every Long-Legged Doji qualifies as a rickshaw man.
Does the centered body change the meaning? Honestly, no — standard references don't assign it a materially different signal. The dead-center close is sometimes read as the “purest” form of the same two-sided balance, and shape-only tests (notably Thomas Bulkowski's candlestick studies) find its resolution close to random without context. Treat it exactly like any Long-Legged Doji: prior trend, location, volume, and a confirmation close beyond the range decide whether it matters.
Volatility Is Not Direction
This is the section that makes the Long-Legged Doji guide different from every other pattern guide. Most candle patterns teach you what direction the market is going. The Long-Legged Doji teaches you that big moves don't always mean anything.
When you see a session with a massive range — price up 3%, then down 3%, closing flat — the instinct is to assume something important happened. A shakeout. A reversal. A trap. But sometimes the answer is simpler: the market is confused, and high volatility is the expression of that confusion.
The practical takeaway: after a Long-Legged Doji, reduce your position size. The wide range means your stop needs to be wider (to avoid getting stopped by the noise), which means you need to trade smaller to keep risk constant. Traders who size their positions as if volatility is normal after a Long-Legged Doji are the ones who get stopped out by the next session's noise.
How to Trade the Long-Legged Doji
The Long-Legged Doji is harder to trade than its calmer relatives because the wide range creates wider stops and more uncertainty. The process is the same — but the sizing needs to adjust.
Strong prior trend — no exceptions
Like all Dojis, the Long-Legged version only matters after a sustained directional move. After a downtrend, it suggests seller exhaustion. After an uptrend, buyer exhaustion. Mid-range, it's just a volatile day.
Check the range against recent averages
If the Long-Legged Doji's range is significantly wider than the stock's average daily range, that's the market telling you volatility has expanded. Factor this into your stop placement and position sizing.
Wait for confirmation — it may be delayed
High-volatility sessions often lead to continued uncertainty. Don't expect a clean confirmation candle immediately. The Long-Legged Doji may need several sessions of consolidation before direction resolves.
Use the candle's range for stop placement
The high and low of the Long-Legged Doji define the battle zone. A close beyond either extreme is a genuine resolution. Place your stop beyond the opposite extreme — wider than usual, but meaningful.
A Long-Legged Doji appears after a 4-week downtrend. The session's range is 3x the average daily range. Volume is extremely high. The next two sessions are small-bodied candles with narrow ranges. RSI shows a divergence — price made a new low in the Doji's shadow but RSI didn't make a new low.
What is the divergence telling you, and how does it change your approach?
Reading the Long-Legged Doji in Context
Four lenses decide whether a Long-Legged Doji is a signal or just noise: volume, structure, momentum, and the level it forms at. Each gets its own dedicated guide; this is the quick orientation.
Volume — was the wide range a real fight or thin-tape volatility? A Long-Legged Doji on heavy volume means real money was behind both the rally and the selloff — a genuine battle. The same wide range on low volume may just reflect a few large orders moving a thin market, not meaningful indecision. Read the Candlesticks + Volume guide →
Structure — where on the chart did the wide range happen? A Long-Legged Doji near support or resistance can be a shakeout — price punched through, triggered stops, then snapped back. The same wide range in open space, far from any level, is usually just volatility with no structural anchor. Read the Candlesticks + Moving Averages guide →
Momentum — is the dominant side stretched or just resting? A Long-Legged Doji at an RSI extreme (below 30 or above 70) often marks final capitulation — the last burst of volatility before the exhausted side gives up. RSI divergence (price makes a new extreme but RSI doesn't) makes the read stronger. A wide range while RSI is flat says nothing new. Read the Candlesticks + RSI guide →
Levels — did the battle happen where traders are watching? A Long-Legged Doji in the Fibonacci golden pocket of a pullback is a violent two-way fight at a price many traders already have marked — indecision at a level that matters. The same wide range between levels is just a loud session in empty space. Read the Candlesticks + Fibonacci guide →
Pattern tells me where to look, context tells me whether to act.
Seeing the Long-Legged Doji in Action: $AWK
Here's a Long-Legged Doji that played out — eventually, with the patience the candle demands.
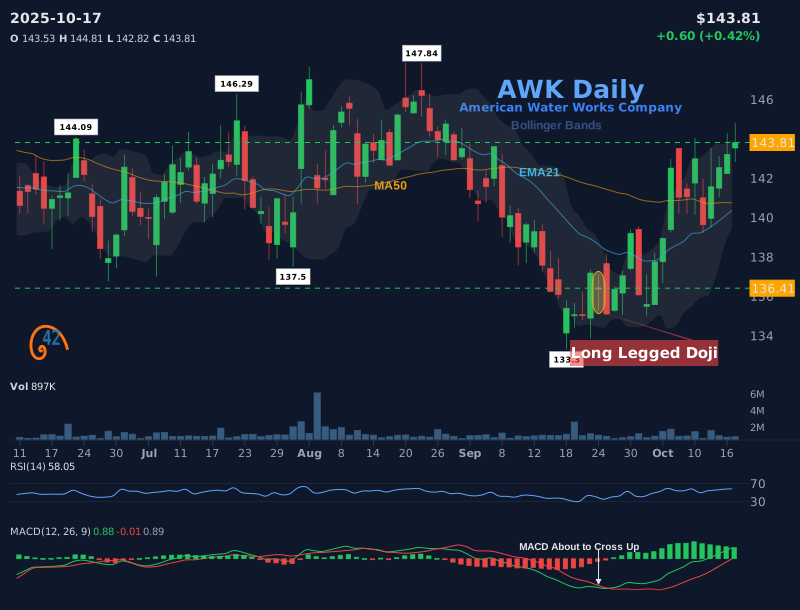
Before the Long-Legged Doji. American Water Works ($AWK) had been declining from a late August peak near $147 through late September — clear downtrend, lower highs, lower lows.
The Long-Legged Doji prints. In late September, an extreme-range session — price swung widely in both directions and closed right back at the open. The lows were defended. MACD was beginning to turn up.
Bears test first. The session immediately after the Long-Legged Doji is bear-dominated — they push toward the Doji's low but can't penetrate it meaningfully.
Bulls gradually take it back. Over the following sessions, buyers rebuild control, eventually closing above both the Long-Legged Doji's close and its high. The stalemate held, and resolved upward.
Why this one was tradeable. Clear prior downtrend, defended lows on the Long-Legged Doji, MACD turning up — and confirmation that came (eventually) above the Doji's high.
Common Long-Legged Doji Trading Mistakes
The Long-Legged Doji creates unique problems because the wide range tempts traders into overreacting. The most common mistakes come from confusing volatility with direction.
The range was huge — this must be important. Go all in.
A wide range with no close away from the open is volatility without conviction. The signal's strength depends on context and confirmation, not range size.
Trade the same size as any other setup — the stop is just wider.
Wider stop = larger potential loss per share. Reduce position size to keep dollar risk constant. This is the most practical mistake to avoid.
The follow-up candle didn't resolve anything. Kill the idea and move on.
A violent session needs time to metabolize. Expect a stretch of small-bodied candles while order flow rebalances — that digestion is the setup, not a rejection of it. The signal is invalidated by a close beyond the Doji's extreme, not by one uneventful bar.
A giant range candle inside a consolidation — the breakout has to be next.
Range inside range is just a noisier version of the range. Without a sustained directional move preceding it, a Long-Legged Doji has nothing to resolve; it's a loud day, not a turning point.
The candle shape is all that matters.
The buildup matters. A Long-Legged Doji preceded by Spinning Tops and slowing momentum is the climax of building indecision. A Long-Legged Doji out of nowhere is just noise.
- A wide range does not mean a strong signal — the Long-Legged Doji proves that volatility and direction are different things
- The extremely long shadows show both sides swung hard and neither held — that's instability, not conviction
- After a Long-Legged Doji, reduce position size to account for the wider stop that the range demands
- Confirmation is often delayed — expect 2-3 candles of digestion before direction resolves
- Watch for RSI divergences — when the extreme range happens with fading momentum, it may mark final capitulation
- The buildup matters — Spinning Tops or slowing momentum before the Long-Legged Doji suggest the volatility climax was earned, not random
- The rickshaw man — a Long-Legged Doji with its body at the exact midpoint — carries the same meaning, not a stronger one
Frequently Asked Questions
What is a Long-Legged Doji?
A Long-Legged Doji is a Doji variant with extremely long upper and lower shadows. The open and close are nearly identical, but price traveled significantly in both directions during the session. It signals intense indecision with high volatility — a violent battle between buyers and sellers that ended in a stalemate.
How is a Long-Legged Doji different from a regular Doji?
Both have open ≈ close, but the Long-Legged Doji has much wider shadows, indicating a more dramatic battle between buyers and sellers. A regular Doji suggests calm indecision; a Long-Legged Doji suggests violent disagreement. The wider shadows reflect significantly more intraday range and more emotional trading.
Is a Long-Legged Doji bullish or bearish?
Neither on its own. It signals extreme volatility and indecision. A Long-Legged Doji after a downtrend points to bullish seller exhaustion; after an uptrend at resistance, bearish buyer exhaustion. The prior trend, price level, and delayed confirmation — often over several sessions — reveal the resolution.
How do you manage risk on a Long-Legged Doji trade?
The wide range means your stop will be wider than usual (beyond the Doji's high or low). To keep dollar risk constant, reduce your position size. This is the most practical adjustment specific to the Long-Legged Doji — accept a smaller position in exchange for a sensible stop.
Why does the Long-Legged Doji often have delayed confirmation?
Extreme-range sessions create uncertainty that takes time to resolve. The market often needs 2-3 sessions of small-bodied candles to digest the volatility before committing to a direction. Impatience here usually means getting chopped up in the digestion phase — wait for the consolidation to tighten.
What is the difference between a Long-Legged Doji and a Spinning Top?
A Long-Legged Doji has no body (open = close). A Spinning Top has a small but visible body, showing a slight lean toward one side. Both show indecision, but the Long-Legged Doji is more neutral and typically has noticeably wider shadows reflecting a more volatile session overall.
What is a rickshaw man candlestick?
A rickshaw man is a Long-Legged Doji whose open and close sit at or very near the exact midpoint of the session's range — the body centered between two long shadows. Every rickshaw man is a Long-Legged Doji, but not every Long-Legged Doji qualifies. The name was popularized by Steve Nison, and it carries the same meaning: extreme two-sided indecision, read through context and confirmation.
Is the Long-Legged Doji a reversal pattern?
Not automatically. It marks violent indecision, and after a sustained trend that loss of control can be the first sign of a reversal — but tested on shape alone, without context, its resolution is close to a coin flip. It earns reversal status only with a strong prior trend, a meaningful level, and a confirmation close beyond its range.
What happens after a Long-Legged Doji?
Often, more uncertainty first: extreme-range sessions tend to be followed by a few small, narrow candles while the market digests the volatility. From there, price either reverses, resumes the prior trend, or keeps drifting. The resolution to trust is a close beyond the Doji's high or low — until then, the stalemate is still open.
The Bottom Line
The Long-Legged Doji teaches the lesson that no other pattern teaches as clearly: just because the market moved a lot doesn't mean it went anywhere.
Activity is not the same as information. Volatility is not the same as direction. A session that covers a massive range and closes flat is the market at its most confused — and confused markets require more patience, smaller positions, and more evidence before you commit.
The traders who profit from Long-Legged Dojis are the ones who size correctly, wait for delayed confirmation, and read the buildup that preceded the volatility explosion. The signal is real — but only if you give it room to resolve.
Our 42Fibonacci Scanner checks for these conditions automatically across 3,000+ stocks.
Find Long-Legged Doji setups in the scanner →In this guide
'%3e%3crect%20width='240'%20height='240'%20fill='%23FF7A00'%3e%3c/rect%3e%3cg%20transform='matrix(0.07095%200%200%20-0.07095%2015%20220.748)'%20fill='%23FFFFFF'%20stroke='none'%3e%3cpath%20d='M1365%202583%20c-628%20-81%20-1087%20-602%20-1111%20-1258%20-9%20-231%2023%20-399%20111%20-580%20207%20-427%20651%20-631%20900%20-414%20313%20274%2067%20875%20-305%20744%20-177%20-63%20-242%20-307%20-110%20-418%2098%20-83%20230%20-43%20230%2069%200%2047%20-5%2051%20-34%2029%20-55%20-42%20-117%204%20-100%2073%2020%2082%20131%20108%20196%2046%2074%20-71%20100%20-207%2058%20-316%20-65%20-174%20-281%20-266%20-437%20-185%20-146%2075%20-276%20272%20-340%20515%20-34%20128%20-39%20396%20-10%20532%20103%20479%20422%20837%20856%20958%20143%2040%20402%2039%20536%20-1%20434%20-132%20743%20-484%20841%20-959%2019%20-91%2024%20-295%2011%20-413%20-11%20-91%20-2%20-80%2029%2041%2080%20312%2017%20689%20-163%20972%20-253%20397%20-715%20623%20-1158%20565z'%3e%3c/path%3e%3cpath%20d='M2035%201809%20c-63%20-18%20-121%20-85%20-140%20-161%20-6%20-23%20-3%20-27%2027%20-33%2018%20-3%2040%20-9%2050%20-11%2011%20-3%2018%203%2023%2023%2025%20113%20189%20126%20225%2018%2031%20-93%20-7%20-155%20-243%20-409%20-86%20-92%20-88%20-96%20-85%20-138%20l3%20-43%20223%20-2%20222%20-3%200%2045%20c0%2025%20-1%2048%20-2%2053%20-3%207%20-22%208%20-191%2011%20l-98%201%2075%2083%20c167%20181%20210%20263%20204%20379%20-8%20148%20-140%20232%20-293%20187z'%3e%3c/path%3e%3cpath%20d='M1579%201733%20c-29%20-43%20-106%20-154%20-171%20-247%20-107%20-152%20-118%20-173%20-118%20-212%20l0%20-44%20173%20-2%20172%20-3%203%20-88%203%20-89%2052%204%20c32%202%2052%208%2053%2016%201%206%202%2046%203%2087%20l1%2075%2045%200%2045%200%200%2050%200%2050%20-45%200%20-45%200%20-1%20173%20c-1%2094%200%20202%201%20240%20l2%2067%20-60%200%20-60%200%20-53%20-77z%20m58%20-400%20c-3%20-2%20-52%20-2%20-110%20-1%20l-105%203%20107%20155%20106%20155%203%20-154%20c1%20-85%201%20-156%20-1%20-158z'%3e%3c/path%3e%3c/g%3e%3c/g%3e%3c/svg%3e)
42Fibonacci