A Spinning Top is a single-candle pattern with a small real body and shadows extending both above and below. It shows buyers and sellers both pushed during the session, but neither took decisive control. The small body marks a slight directional lean, unlike a Doji, which shows none; trade the confirmation, not the candle itself.
The Doji is a stalemate. The Spinning Top is a stalemate where one side slightly flinched. That flinch is information.
What Makes a Spinning Top
The Spinning Top is defined by three characteristics: a small real body sitting roughly in the middle of the candle's range, with shadows extending both above and below that are longer than the body itself. The shadows should be roughly similar — they don't need to match exactly.
The name is visual — imagine a toy top spinning on a table. The body is the spindle, the shadows are the wide edges whirling on either side. It's a candle that went somewhere during the session but ultimately didn't commit.
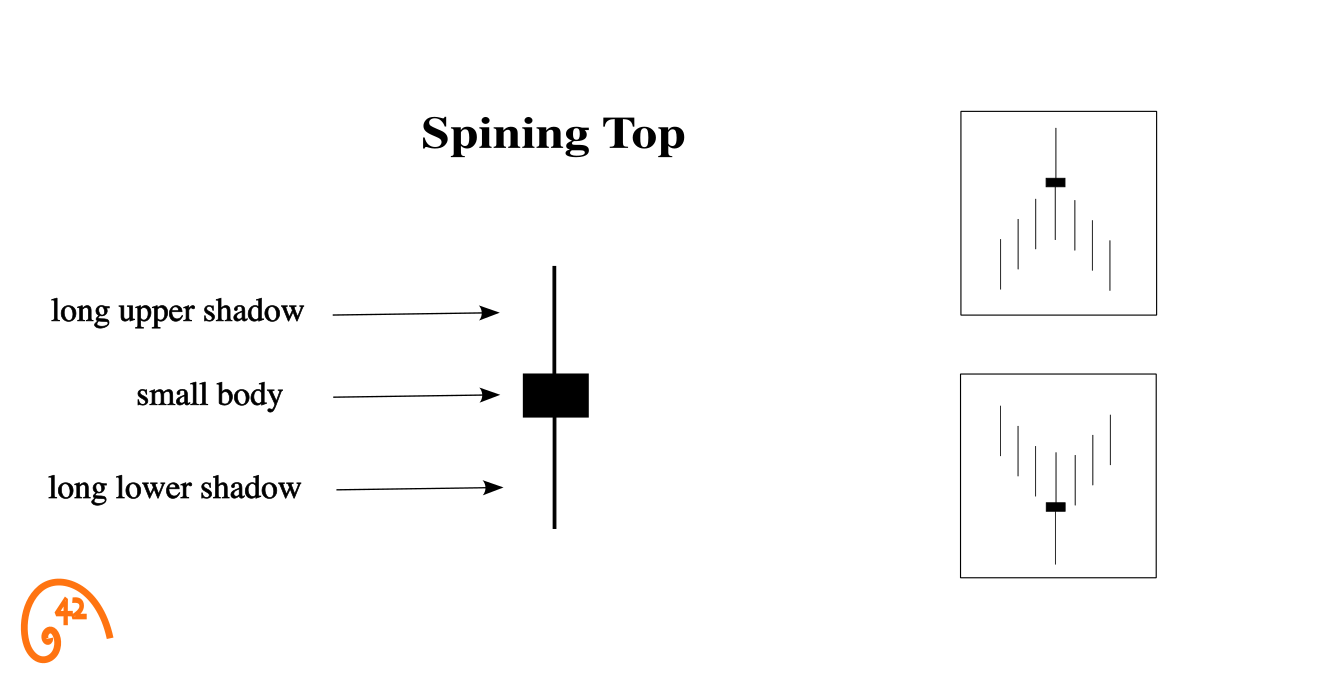
How a Spinning Top Forms
The Spinning Top tells a story of a session where both sides had their moment — and neither could make it stick. But unlike the Doji, someone came away with a slight edge. Here's how that unfolds:
"There's some demand here. Price is lifting off the open."
Early in the session, buyers gain the upper hand. Price moves above the open, creating the upper shadow. It's not a stampede — more like tentative bidding. Enough to move the needle, not enough to hold conviction.
"Sellers are pushing back. The rally didn't hold."
Sellers respond and drive price below the open, creating the lower shadow. Longs from the morning session are now offside. For a moment it looks like sellers might take control — but they can't sustain the pressure either.
"Almost back to where we started — but not quite."
By the close, price settles near (but not at) the open. The session produced range and volatility but almost no net progress. The small body is what's left — a faint directional lean after a full day of tug-of-war.
The key difference from the Doji is that small body. It means one side slightly outperformed the other. A green body means buyers closed above the open. A red body means sellers closed below it. Neither victory is convincing — but neither is it nothing.
Think of the Spinning Top as a momentum reading, not a direction signal. After a strong trend, this candle says: "The dominant side is still here, but they're losing steam." Whether that loss of steam becomes a reversal or just a brief pause depends on what follows.
Is a Spinning Top Bullish or Bearish?
Neither — by itself, a Spinning Top is neutral. It marks a momentum pause, not a direction. The prior trend gives it a lean — after a downtrend it reads as a potential bullish reversal; after an uptrend, a potential bearish one. Same candle, opposite stories, decided entirely by what came before it, and confirmed only by the candle that follows.
One more dose of honesty: Spinning Tops are among the most common candles on any chart, so most of them mean nothing. Choppy markets manufacture them by the dozen. The read below only applies when a Spinning Top interrupts a real directional move.
The two to distinguish:
Bullish Spinning Top
Appears after a downtrend. Sellers were in control — multiple sessions of lower closes — then a Spinning Top prints. The pause doesn't mean buyers won. It means sellers lost their grip. That's the first crack.
Bearish Spinning Top
Appears after an uptrend. Buyers were in control — multiple sessions of higher closes — then a Spinning Top prints. The pause doesn't mean sellers won. It means buyers lost their grip. That's the first crack.
The Doji and Long-Legged Doji read the same way: bullish after a downtrend, bearish after an uptrend. A Spinning Top's body color adds a faint lean at most — green means buyers edged the close, red means sellers did — but the small body, not its tint, is the message.
Spinning Top vs. Doji (and Other Lookalikes)
The Spinning Top sits in a family of indecision candles that share the same general shape — shadows on both sides, small or nonexistent body. The differences are subtle but meaningful, because each tells a slightly different story about the balance of power.
- Small but visible body between the shadows
- Slight directional lean — one side edged out
- No real body — open and close are virtually equal
- Perfect stalemate, no directional lean
- No body, but extreme range on both sides
- Wild volatility ending in a stalemate
- Body at top, long shadow only on one side
- Clear directional rejection — not indecision
The Spinning Top and Doji are the closest siblings. The difference is the body. The Doji says "neither side won." The Spinning Top says "one side barely won." That makes the Doji the more extreme indecision reading of the two — and where exactly a small body becomes "no body" is a judgment call, not a rule. The nuance matters when you're reading momentum.
The Long-Legged Doji shares the Spinning Top's wide range but has no body — it's extreme volatility ending in perfect balance. The Hammer is the easiest to distinguish: its shadow falls on one side only, showing clear rejection rather than two-sided indecision.
Where the Spinning Top Appears in Other Patterns
The Spinning Top is also a building block inside larger reversal patterns — always playing the same role: the hesitation between the old move and the new one.
As the “star.” The middle candle of a Morning Star (or its bearish mirror, the Evening Star) is often a Spinning Top — the pause between the strong red candle and the strong green one. When that middle candle is a Doji instead, the pattern is the Doji-star variant, generally read as the stronger version for the same reason a Doji is the more extreme indecision candle.
As the “child” in a Harami. A Spinning Top whose body sits entirely inside the prior candle's long body forms a Harami — momentum stalling inside the range of the move that preceded it. (With a Doji as the inside candle, it becomes the Harami Cross.)
One Spinning Top is a pause. Three Spinning Tops at the same level is a coiled spring.
How to Trade the Spinning Top
The Spinning Top is not a standalone entry signal. It's a momentum indicator — a candle that tells you the prevailing trend is losing conviction. How you use that information depends on what else the chart is telling you.
Identify the prevailing trend
A Spinning Top only carries weight when it interrupts momentum. After a sustained move — multiple sessions of strong directional closes — a Spinning Top marks the first sign of hesitation. Without a clear prior trend, the candle is just noise in a choppy market.
Check the structural context
Where on the chart is this Spinning Top forming? Near the 200-day moving average, a Fibonacci retracement, or a prior support/resistance zone — that's where a momentum pause is most likely to become something more. A Spinning Top in open space with no nearby structure is likely just the trend breathing.
Read the body color as a clue, not a verdict
A green Spinning Top in a downtrend is a slightly stronger hint of reversal — buyers managed to close above the open, even if barely. A red Spinning Top in a downtrend suggests the bears are still technically winning but losing grip. The color tilts the odds slightly, but confirmation from the next session is what matters.
Wait for the next candle to resolve the ambiguity
The Spinning Top raises the question. The next candle answers it. A strong close above the Spinning Top's high confirms the pause was a turning point. A close below the Spinning Top's low confirms the trend is resuming. Acting on the Spinning Top itself is trading ambiguity.
You notice three Spinning Tops in a row at the same price level after a 2-week decline. Each one has a slightly different body size and shadow length, but they're all clustered around the $45 area. RSI is approaching oversold. No single candle has confirmed a reversal yet.
Is this clustering significant, or just choppy price action?
Reading the Spinning Top in Context
Four lenses decide whether a Spinning Top is a signal or just noise: volume, structure, momentum, and the level it forms at. Each gets its own dedicated guide; this is the quick orientation.
Volume — was the pause fought or drifted into? A Spinning Top on declining volume means the dominant side is running out of participants — the trend is quietly losing fuel. A Spinning Top on a volume spike means both sides showed up and neither could take the session, which often precedes a larger move once the tension resolves. Read the Candlesticks + Volume guide →
Structure — where on the chart did it form? A single Spinning Top at support, resistance, or a moving average is a hesitation at a level that matters. Two or three Spinning Tops at the same zone is the market coiling — quietly absorbing supply or stalling demand until something gives. A Spinning Top in open space, far from any structure, is usually just the trend breathing. Read the Candlesticks + Moving Averages guide →
Momentum — is the dominant side stretched or just resting? A Spinning Top when RSI is near 50 is unremarkable — momentum was already flat. A Spinning Top when RSI is stretched toward 70 or 30, or when the MACD histogram has been shrinking session after session, is the first visible crack in an overextended move. Read the Candlesticks + RSI guide →
Levels — did the pause happen where traders are watching? A Spinning Top in the Fibonacci golden pocket of a pullback is hesitation exactly where many traders expect a trend to resume — a pause worth watching. The same candle drifting between levels is just the market breathing. Read the Candlesticks + Fibonacci guide →
Pattern tells me where to look, context tells me whether to act.
One Spinning Top vs. Many
A single Spinning Top is a pause. It tells you the dominant side hesitated for one session. Maybe they resume tomorrow. Maybe not. It's ambiguous by definition.
But when multiple Spinning Tops appear in a row — two, three, even four sessions of small-bodied candles at roughly the same price — the message changes entirely. That's no longer hesitation. That's compression. The market is building pressure at a level, and whichever side breaks through will likely trigger a fast move.
Clustering is especially meaningful at support. Multiple Spinning Tops at support suggest that sellers keep testing the level and buyers keep absorbing the supply. Each failed push lower adds energy to the eventual bounce. At resistance, the same logic applies in reverse — buyers keep trying and failing, and each failure makes the eventual breakdown more likely.
Seeing the Spinning Top in Action: $HCA
Here's a Spinning Top that earned its weight — at the 200-day moving average, after a sustained decline, on elevated volume.

Before the Spinning Top. Healthcare Corp of America ($HCA) spent much of mid-2025 coiling between $390 and $363. That range broke to the downside in late July, and sellers walked the stock steadily lower toward a well-watched level: the 200-day moving average — the line institutional desks treat as the divide between long-term uptrend and downtrend.
The Spinning Top prints. Right at the 200-day MA, on elevated volume, a small-bodied candle appears with shadows on both sides. Sellers pushed lower during the session, buyers absorbed the pressure, and the close landed near the open. After weeks of one-sided selling, the market suddenly couldn't pick a direction.
The next session. The following candle closed above the Spinning Top's high. Buyers followed through, the hesitation resolved in their favor, and price ran a 6-bar bullish advance back toward the prior $363–$390 consolidation range — a natural target sitting right where the breakdown started.
Why this one was tradeable. Strong prior trend (multi-week decline), meaningful level (the 200-day MA), elevated volume (the pause was fought), and a clean confirmation candle. Without those layers the Spinning Top is just another small-bodied candle.
Common Spinning Top Trading Mistakes
The Spinning Top is one of the most common candles on any chart. That frequency is exactly what makes it dangerous — traders assign meaning to every one they see instead of filtering for the ones that actually matter.
A Spinning Top appeared — time to reverse the position.
The Spinning Top is a momentum indicator, not a trade trigger. Wait for the next candle to resolve the ambiguity before acting.
A Spinning Top just printed in a consolidation — compression is resolving any second now.
Sideways price action is a Spinning Top factory; they are a symptom of the range, not a prediction about it. The Spinning Top only earns attention when it appears inside a directional trend and interrupts its rhythm.
The body is tiny — whether it closed a nickel above or below the open is irrelevant.
A fractional bullish close inside a downtrend still means buyers finished the session ahead, even narrowly. That micro-win is a lean, not a verdict — but it skews the odds just enough to treat one Spinning Top as slightly more constructive than another.
Each Spinning Top is an independent event. Analyze them one at a time.
Multiple Spinning Tops at the same price level indicate compression and accumulation. The cluster is the signal, not the individual candle. Watch for 2–3 small-bodied candles at the same zone.
Shape is all that matters. Volume is a separate analysis.
A Spinning Top on declining volume means conviction is fading. A Spinning Top on a volume spike means the pause was genuinely contested. The volume trend tells you which kind of pause you're looking at.
- The Spinning Top has a body the Doji doesn't — and that small body shows a slight directional lean worth reading
- It's a momentum indicator, not a signal: the Spinning Top tells you the trend is losing conviction, not that it's over
- Body color is a clue — a green body in a downtrend hints at reversal slightly more than a red one
- Clustering is the advanced concept: multiple Spinning Tops at the same level indicate compression and building pressure
- Volume trend matters — declining volume alongside a Spinning Top means the trend is running out of participants
- Always wait for the next candle: the Spinning Top raises the question, the confirmation candle answers it
Frequently Asked Questions
What is a Spinning Top candlestick pattern?
A Spinning Top is a single-candle pattern with a small real body and shadows extending both above and below. It signals that buyers and sellers both pushed during the session, but neither side could take decisive control. The small body shows a slight directional lean — unlike the Doji, which shows none.
How is a Spinning Top different from a Doji?
The key difference is the body. A Doji has virtually no body — open and close are at the same price. A Spinning Top has a small but visible body, meaning one side slightly outperformed the other. Both signal indecision, but the Spinning Top carries a faint directional preference.
Is a Spinning Top bullish or bearish?
On its own, neither. The Spinning Top signals indecision with a slight lean. Its meaning comes from context — where it forms (support vs. resistance), what trend preceded it, and what the next candle does. A green Spinning Top at support after a downtrend leans bullish; the opposite at resistance leans bearish.
How do you trade a Spinning Top?
Don't trade the Spinning Top itself — trade the confirmation. Wait for the next candle to close above the Spinning Top's high (bullish) or below its low (bearish). The Spinning Top identifies the moment of hesitation; the next candle tells you which side won the resolution.
Does the body color of a Spinning Top matter?
It matters slightly. A green (bullish) body means buyers closed above the open; a red (bearish) body means sellers closed below it. In the context of a potential reversal, the body color provides a small additional clue — but it's not sufficient on its own. Confirmation from the next session is what counts.
What does it mean when multiple Spinning Tops appear at the same level?
Clustering — multiple small-bodied candles at the same price zone — signals that the market is compressing at that level. Buyers and sellers are repeatedly testing each other without resolution. This compression builds energy, and the eventual breakout (in either direction) tends to produce a sharp, decisive move.
Is a Spinning Top a reversal pattern?
Not automatically. It marks a momentum pause, and after a sustained trend that pause can be the first sign of a reversal — but it can just as easily resolve as a rest stop before the trend continues. It earns reversal status only with a strong prior trend, a meaningful level, and a confirmation close beyond its range. Spinning Tops are also very common candles, so most instances carry no signal at all.
What is the difference between a Spinning Top and a Long-Legged Doji?
Both have wicks on both sides, but they differ in the body: a Spinning Top has a small, visible real body, while a Long-Legged Doji has virtually none — plus deliberately extreme shadows. The Long-Legged Doji is the more violent, more extreme indecision reading; the Spinning Top is the everyday version with a faint directional lean surviving in the body.
Can a Spinning Top appear inside other candlestick patterns?
Yes — it's a common building block. The middle 'star' candle of a Morning Star or Evening Star is often a Spinning Top (when it's a Doji instead, the pattern is the stronger Doji-star variant). A Spinning Top contained within the prior candle's body also forms a Harami. In both roles it plays the same part: the moment of hesitation between the old move and the new one.
The Bottom Line
The Spinning Top teaches momentum reading — the subtle art of distinguishing a rest stop from a turning point.
It won't tell you where the market is going. No single candle can. What it tells you is that the side driving the trend just had its weakest session. Whether that weakness is temporary fatigue or the beginning of a reversal depends on the structural level, the volume behind it, and — always — the next candle.
Master the Spinning Top and you'll develop an eye for something most traders overlook: the moments when momentum is quietly shifting before the move becomes obvious. Those moments are where edge lives.
Our 42Fibonacci Scanner checks for these conditions automatically across 3,000+ stocks.
Find Spinning Top setups in the scanner →In this guide
'%3e%3crect%20width='240'%20height='240'%20fill='%23FF7A00'%3e%3c/rect%3e%3cg%20transform='matrix(0.07095%200%200%20-0.07095%2015%20220.748)'%20fill='%23FFFFFF'%20stroke='none'%3e%3cpath%20d='M1365%202583%20c-628%20-81%20-1087%20-602%20-1111%20-1258%20-9%20-231%2023%20-399%20111%20-580%20207%20-427%20651%20-631%20900%20-414%20313%20274%2067%20875%20-305%20744%20-177%20-63%20-242%20-307%20-110%20-418%2098%20-83%20230%20-43%20230%2069%200%2047%20-5%2051%20-34%2029%20-55%20-42%20-117%204%20-100%2073%2020%2082%20131%20108%20196%2046%2074%20-71%20100%20-207%2058%20-316%20-65%20-174%20-281%20-266%20-437%20-185%20-146%2075%20-276%20272%20-340%20515%20-34%20128%20-39%20396%20-10%20532%20103%20479%20422%20837%20856%20958%20143%2040%20402%2039%20536%20-1%20434%20-132%20743%20-484%20841%20-959%2019%20-91%2024%20-295%2011%20-413%20-11%20-91%20-2%20-80%2029%2041%2080%20312%2017%20689%20-163%20972%20-253%20397%20-715%20623%20-1158%20565z'%3e%3c/path%3e%3cpath%20d='M2035%201809%20c-63%20-18%20-121%20-85%20-140%20-161%20-6%20-23%20-3%20-27%2027%20-33%2018%20-3%2040%20-9%2050%20-11%2011%20-3%2018%203%2023%2023%2025%20113%20189%20126%20225%2018%2031%20-93%20-7%20-155%20-243%20-409%20-86%20-92%20-88%20-96%20-85%20-138%20l3%20-43%20223%20-2%20222%20-3%200%2045%20c0%2025%20-1%2048%20-2%2053%20-3%207%20-22%208%20-191%2011%20l-98%201%2075%2083%20c167%20181%20210%20263%20204%20379%20-8%20148%20-140%20232%20-293%20187z'%3e%3c/path%3e%3cpath%20d='M1579%201733%20c-29%20-43%20-106%20-154%20-171%20-247%20-107%20-152%20-118%20-173%20-118%20-212%20l0%20-44%20173%20-2%20172%20-3%203%20-88%203%20-89%2052%204%20c32%202%2052%208%2053%2016%201%206%202%2046%203%2087%20l1%2075%2045%200%2045%200%200%2050%200%2050%20-45%200%20-45%200%20-1%20173%20c-1%2094%200%20202%201%20240%20l2%2067%20-60%200%20-60%200%20-53%20-77z%20m58%20-400%20c-3%20-2%20-52%20-2%20-110%20-1%20l-105%203%20107%20155%20106%20155%203%20-154%20c1%20-85%201%20-156%20-1%20-158z'%3e%3c/path%3e%3c/g%3e%3c/g%3e%3c/svg%3e)
42Fibonacci